


AA 2018 year in review
 Dec 27, 2018, 9:44 pm
#136
Join Date: Feb 2005
Programs: EXP AA, PLT Marriott
Posts: 324
 Jan 2, 2019, 3:59 pm
#139
Join Date: Nov 2004
Location: Oakland
Programs: AA Explat, UA former 1K + PremExec, DL
Posts: 1,151
Thanks for all the feedback- sorry if your label was cut off
A few names were covered up by overlapping labels (e.g. rowingman). Adjusting the shape and angle helps but in this case aacar is still covered up by IAHtraveler- they have the same # RTW and Top percentile exactly.
Jan 2, 2019, 4:18 pm
#140
Join Date: Nov 2004
Location: Oakland
Programs: AA Explat, UA former 1K + PremExec, DL
Posts: 1,151
Number and distribution of ExPlat BIS mileage
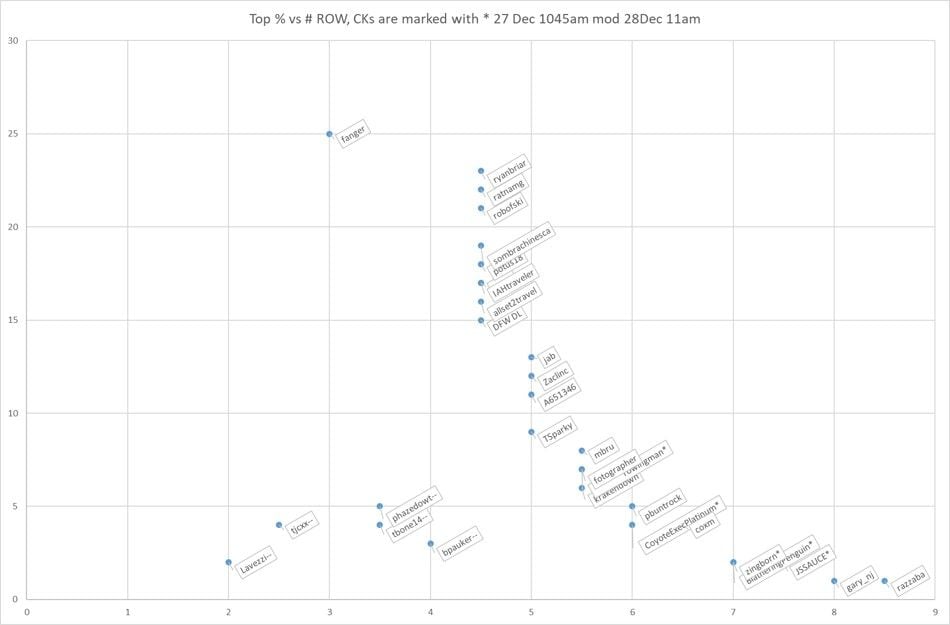
From the 29 non-outlier data points that were reported (# times RTW + Top percentile of Explat/CK), we can clearly infer that 75% of Explat fly 80k BIS or less. I happen to be that 80k/25% data point. Does this make sense?
To earn Explat based on flying you need: 1) 33,334 all in F/J full fare 2) 50000 all in discount F/J 3) 100000 in "normal" Y. I would guess that almost no one falls into category 1 but many fall into category 2 and 3 based on corporate travel rules. Probably there are many too who fly a mix.
However, based on the 29 data points I can plot a distribution like so, guessing at the sub-3.0x distribution as a recapitulation of the 4.0x and greater.
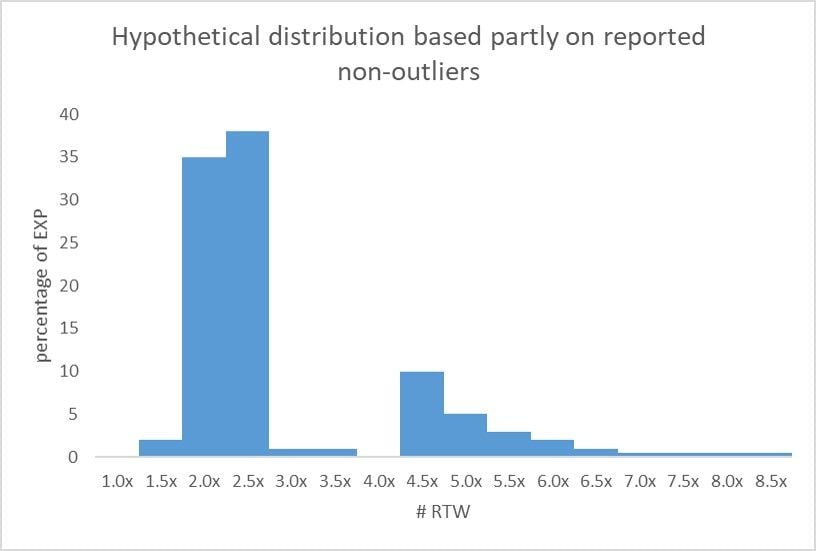
A distribution like this implies an average Explat BIS of around 74k, and thus about 130k Explats given 103x trips to the sun (assuming a standard 93 million miles, the classic attribution in science fiction).
However, there's no particular reason to believe that the distribution we get from the 29 data points is an accurate description (n is small and non-random) so I give a couple of variants for consideration. Also, I am neglecting segment qualifiers- no idea how many there are of those, but would guess they would fall into the 1.0x-1.5x bins.
Hypothesis #2 - The discount F/J qualifiers mostly just get over the hump and not into the 2.5x bin.
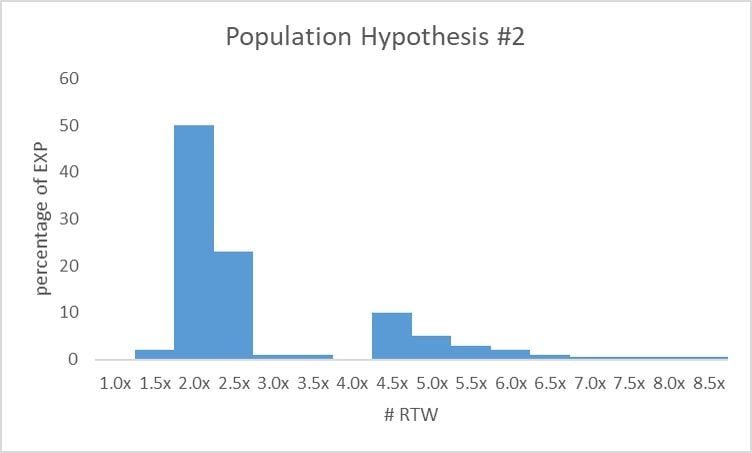
This distribution implies about 72k BIS average thus 133k explats.
And finally a more even distribution, still following the natural thresholds at 2.0x and 4.0x (50k and 100k) but assuming most qualifiers push past the limits a bit more than a hair.
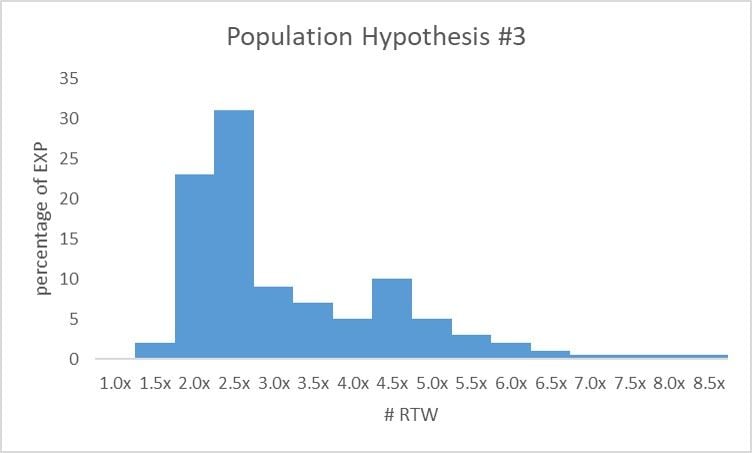
This distribution implies about 80k BIS average and thus implies 120k Explats.
Too bad there weren't more reported data points- I was hoping for a more confident estimation of the distribution. I think it likely that this email was some kind of marketing/CS test distributed not widely, and perhaps they realized it potentially discloses a lot of proprietary information- not to mention the privacy errors in the initial implementation.
Anyway, Happy New Year everybody!
To earn Explat based on flying you need: 1) 33,334 all in F/J full fare 2) 50000 all in discount F/J 3) 100000 in "normal" Y. I would guess that almost no one falls into category 1 but many fall into category 2 and 3 based on corporate travel rules. Probably there are many too who fly a mix.
However, based on the 29 data points I can plot a distribution like so, guessing at the sub-3.0x distribution as a recapitulation of the 4.0x and greater.
A distribution like this implies an average Explat BIS of around 74k, and thus about 130k Explats given 103x trips to the sun (assuming a standard 93 million miles, the classic attribution in science fiction).
However, there's no particular reason to believe that the distribution we get from the 29 data points is an accurate description (n is small and non-random) so I give a couple of variants for consideration. Also, I am neglecting segment qualifiers- no idea how many there are of those, but would guess they would fall into the 1.0x-1.5x bins.
Hypothesis #2 - The discount F/J qualifiers mostly just get over the hump and not into the 2.5x bin.
This distribution implies about 72k BIS average thus 133k explats.
And finally a more even distribution, still following the natural thresholds at 2.0x and 4.0x (50k and 100k) but assuming most qualifiers push past the limits a bit more than a hair.
This distribution implies about 80k BIS average and thus implies 120k Explats.
Too bad there weren't more reported data points- I was hoping for a more confident estimation of the distribution. I think it likely that this email was some kind of marketing/CS test distributed not widely, and perhaps they realized it potentially discloses a lot of proprietary information- not to mention the privacy errors in the initial implementation.
Anyway, Happy New Year everybody!
Jan 4, 2019, 1:26 pm
#141
Join Date: Oct 2001
Location: Fort Worth, Texas USA
Programs: AA Executive Platinum 5 million miles
Posts: 1,001
Just found my email from AA. Stats are: hours in the sky 218; 4.5 times flown around the world; top 17% rank among Executive Platinum members; 62,986 bonus miles from elite status; 149,834 award miles earned without flying. My mother is also Executive Platinum and her stats are: 172 hours in the sky; 3.5 times flown around the world; top 5% rank among Executive Platinum members; 59,852 bonus miles from elite status; 15,171 award miles earned without flying.
I flew more EQMs and spent more EQDs than she did but she is in the top 5% and I am only 17%.
I flew more EQMs and spent more EQDs than she did but she is in the top 5% and I am only 17%.
Jan 4, 2019, 3:13 pm
#142
Join Date: Dec 2013
Location: SFO/STS
Programs: AA EXP, HH Diamond
Posts: 396
Just saw this thread so I went back to the email to report:
- 137 hours
- 2x around the world (59,829 BIS)
- 9 destinations visited (actually 12)
- longest flight SFO - ORD
- Most visited SFO (home airport), IAH, DFW
- A 321
- Requalified Nov 14
- 25+ Upgrades (29 or 72% of eligible legs upgraded - 25 of 61 segments were I fares))
- $1,110 in checked bag savings (makes sense since I often check wine)
Jan 4, 2019, 3:26 pm
#143
Join Date: Feb 2005
Programs: EXP AA, PLT Marriott
Posts: 324
Just found my email from AA. Stats are: hours in the sky 218; 4.5 times flown around the world; top 17% rank among Executive Platinum members; 62,986 bonus miles from elite status; 149,834 award miles earned without flying. My mother is also Executive Platinum and her stats are: 172 hours in the sky; 3.5 times flown around the world; top 5% rank among Executive Platinum members; 59,852 bonus miles from elite status; 15,171 award miles earned without flying.
I flew more EQMs and spent more EQDs than she did but she is in the top 5% and I am only 17%.
I flew more EQMs and spent more EQDs than she did but she is in the top 5% and I am only 17%.
Your stats make sense based on the fanger chart.
Jan 4, 2019, 5:40 pm
#144
Join Date: Jan 2017
Location: COU
Programs: AA EXP, Bonvoy Ambassador, Hertz PC
Posts: 499
In any case, your actual point here is very well taken; the fact that J/F and Y flyers have very different earning thresholds is a perfect explanation for the bimodal distribution. Great observation, I hadn't considered that at all.
Too bad there weren't more reported data points- I was hoping for a more confident estimation of the distribution. I think it likely that this email was some kind of marketing/CS test distributed not widely, and perhaps they realized it potentially discloses a lot of proprietary information- not to mention the privacy errors in the initial implementation.

Happy New Year to you too fanger, and thanks for more cool stuff!
Jan 4, 2019, 6:08 pm
#145
Join Date: Feb 2005
Programs: EXP AA, PLT Marriott
Posts: 324
Yes, that checks out. I'd be careful though making a similar statement about the RTW numbers due to the big rounding effects. 80k is after all 3.2x RTW, so you're very close to the breakpoint where they'd start calling you 3.5x. I think it's probably a good guess that some of the lower 4.5x folks are down pretty close to the 4.0x breakpoint too. I wonder if it changes anything in your distribution if you were to distribute each RTW across its range; that is, put you at 3.2 (since we know that one from your BIS number) and ryanbriar at 4.25 (lowest he could be with rounding) and step the other 4.5 flyers up until DFWDL is at 4.74x. This isn't really "right" since we're kind of making up some data, but there's a strong reason to expect that's closer to reality. My guess is it would smooth out the drop between the two modes a lot.
That's probably true to a first approximation, but there are a couple exceptions. I flew 98k BIS in 2018 (all in discount Y) and ended with 110k EQM because I take quite a few sub-500mi flights. Also people who qualify by EQS could have lower numbers. And then there are people with the Citi card that gives you 10k; if they're squeaking past they could be low too. I have no idea how many people fall into these categories or whether it would meaningfully impact your distribution.
In any case, your actual point here is very well taken; the fact that J/F and Y flyers have very different earning thresholds is a perfect explanation for the bimodal distribution. Great observation, I hadn't considered that at all.
Yeah, in particular it sure would have been nice to get a couple between 3 and 4.5; of course now we think there are surprisingly few of those folks, but still. I was at 4.0x; sure wish they'd have included the percentile! But of course what I really, really wish is they'd have included EQD percentiles
Happy New Year to you too fanger, and thanks for more cool stuff!
Makes sense what you are saying. I suspect AA was using actual numbers when assigning % and not the base RTW numbers that were used to graph - I think you are saying the same thing that I am saying.
I would suspect that we didn't see much more in the fanger range is that the number was probably 3.24 and that AA didn't send anyone a % if they were not top 25%. Can you imagine the CK that could get offended if they were in the 99% group and get cranky with AA?
Jan 5, 2019, 10:51 am
#146
Join Date: Dec 2005
Programs: AA EXP, Marriott Amb Elite & LT Titanium, Hilton Diamond
Posts: 1,230
I've read most of this but maybe I missed it but, how many 'minimal' flying CK's post here, I'd suspect that the CK data is skewed since this is based on self-reporting and is not a statistically valid survey.
EXP's that are flying to make status are more likely to be on here, but of the EXP's I know most of them have not heard of FT. That's not a statistically valid sample either but does suggest we are smaller subset of the overall population.
FWIW - my report was
217 hours
3.5 RTW
15 Destinations
Most visited Dallas (ha I live in Dallas) and they included Dublin, went there once.
Earned exp on 10/25
25+ UG's
For EQD $21k, and thanks to the few that posted theirs, at least I know why I'm was 2 for 42 on UG's to LGA/EWR.
No percentage now I know why (oddly when I called EXP line last they said I was in top 10%, but that may be of all flyers, only time they've said that to me).
AA would be smarter to share your percentage, preferably based on spending, but they are afraid of what this thread shows, an EQD of 38k gets you 22% on the EXP list (yes not dollars but going to be relative) and there is minimal value in chasing EQD to move up the list if your spending is between at least 12k and 22k.
Jan 6, 2019, 7:41 pm
#147
Join Date: Jan 2017
Location: COU
Programs: AA EXP, Bonvoy Ambassador, Hertz PC
Posts: 499
AA would be smarter to share your percentage, preferably based on spending, but they are afraid of what this thread shows, an EQD of 38k gets you 22% on the EXP list (yes not dollars but going to be relative) and there is minimal value in chasing EQD to move up the list if your spending is between at least 12k and 22k.
To get a bit further into the weeds, I also wouldn't expect the EQD distribution to be bimodal like the BIS one, because there's no J/F multiplier to account for. It's hard to say since we don't have any direct data on the EQD distribution, but my prior would be to expect it's a power law. So you'll get diminishing returns as you get higher, but the range just above 12k ought to have some significant gains. I certainly find I do OK with 17k, even though I read so much around here about folks with many times that...generally there are lots more people below me than above me.